Picked a pretty paper

November 18, 2009
by Michael Dale (mrd09)

After our presentation today, we have decided to replicate the results of the first paper in the list of five from the last post. In other words, we’re going to try to model deermice. The paper came to the conclusion that the width of the corridors are secondary in importance to the vegetation coverage of corridors and conservation areas. To put it simply, deermice are hawk bait, so they like to have thick vegetation to avoid predation. If there’s no coverage, the mice won’t use a corridor regardless of width. When you put good coverage in, the width starts to matter.

We will now add more complexity to our model so we can simulate both vegetation and predation. We may or may not need to add preferential movement to the creatures’ behavior, eg. avoiding high predation areas. The best option will probably be to simply play with predation probabilities to simulate cover. If we can replicate the paper’s results, great. If we can do one better, awesome.


What we should look at

November 11, 2009
by Michael Dale (mrd09)

As Lee said in our most recent class, we have pretty much honed our code as far as it will go. He did mention that we might add willful movement to the creatures. But for now, we really need to be focusing on where our model is applicable.

From 4 minutes on Google Scholar, I have five articles that we can scan for a place to put our results. Three of them are JStor articles, so we can get full text. They’re all mid-late 90’s, but it’s a good starting point. Here’s what we should look at:

Influences of corridor continuity and width on survival and movement of deermice Peromyscus maniculatus

We investigated the effects of corridor gaps and corridor width on the survival and movement of resident and non-resident deermice Peromyscus maniculatus. Transplanted non-resident deermice were used to simulate dispersing individuals, and resident deermice served as controls. The study design was a completely randomized 22 factorial with width (narrow or wide) and continuity (with or without a 10-m-wide corridor gap) as factors of interest. Vegetation variables were more significant with movement and number of crossings than were width and continuity. Survival was unaffected by corridor width and continuity, as well as vegetation variables.

http://www.sciencedirect.com/science?_ob=ArticleURL&_udi=B6V5X-4007DH9-7&_user=10&_rdoc=1&_fmt=&_orig=search&_sort=d&_docanchor=&view=c&_searchStrId=1088645450&_rerunOrigin=scholar.google&_acct=C000050221&_version=1&_urlVersion=0&_userid=10&md5=c4a1f6b06a92df01ffcc6d29f753d4b6

Do habitat corridors provide connectivity

Skeptics have questioned the empirical evidence that corridors provide landscape connectivity. Some also have suggested dangers of corridors. We reviewed published studies that empirically addressed whether corridors enhance or diminish the population viability of species in habitat patches connected by corridors. A randomized and replicated experimental design has not been used–and we argue is not required–to make inferences about the conservation value of corridors. Rather, studies can use observational or experimental analyses of parameters of target populations or movements of individual animals. Two of these approaches hold the greatest promise for progress, especially if the shortcomings of previous studies are remedied. First, experiments using demographic parameters as dependent variables–even if unreplicated–can demonstrate the demographic effects of particular corridors in particular landscapes. Such studies should measure demographic traits before and after treatment in both the treated area (corridor created or destroyed) and an untreated area (habitat patches isolated from one another). This approach is superior to observing the demographic conditions in various landscapes because of the tendency for corridor presence to be correlated with other variables, such as patch size, that can confound the analysis. Second, observations of movements by naturally dispersing animals in fragmented landscapes can demonstrate the conservation value of corridors more convincingly than can controlled experiments on animal movement. Such field observations relate directly to the type of animals (e.g., dispersing juveniles of target species) and the real landscapes that are the subject of decisions about corridor preservation. Future observational studies of animal movements should attempt to detect extra-corridor movements and focus on fragmentation-sensitive species for which corridors are likely to be proposed. Fewer than half of the 32 studies we reviewed provided persuasive data regarding the utility of corridors; other studies were inconclusive, largely due to design flaws. The evidence from well-designed studies suggests that corridors are valuable conservation tools. Those who would destroy the last remnants of natural connectivity should bear the burden of proving that corridor destruction will not harm target populations.

http://www.jstor.org/pss/2989843

http://www.jstor.org/pss/3546904

http://www.jstor.org/pss/2386581

http://www.sciencedirect.com/science?_ob=ArticleURL&_udi=B6V5X-4007DH9-G&_user=10&_rdoc=1&_fmt=&_orig=search&_sort=d&_docanchor=&view=c&_searchStrId=1088639477&_rerunOrigin=scholar.google&_acct=C000050221&_version=1&_urlVersion=0&_userid=10&md5=c72137e4e8ca0ce909ff855fba69a5b4

Goals for next week

November 11, 2009
by Tonje Stolpestad (tstolpes)

Put aside th code and the analyzis for now and find a specific research paper that includes what we are dealing with.

Then after next week find the next step


Bridge width

November 11, 2009
by Tonje Stolpestad (tstolpes)

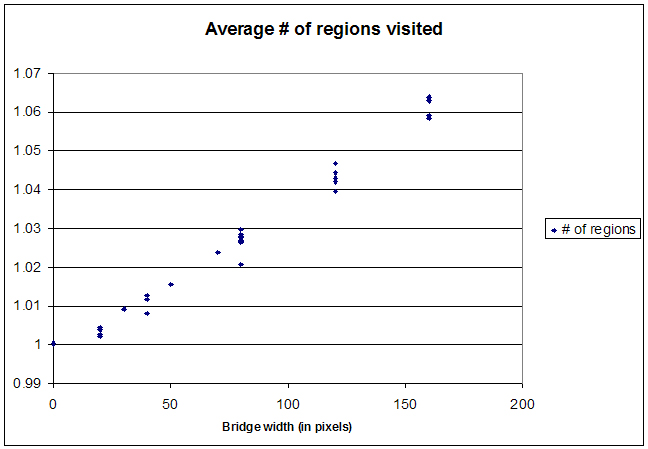
These are the average number of regions visited on 30something runs of our simulation with varying bridge widths. As is very evident there is a strong correlation between the width and the number of regions visited.


Small change to the code

November 8, 2009
by Tonje Stolpestad (tstolpes)

I have added a small change to the code that should make analyzing it easier. It simply records how many regions a marble visisted before it died. This should make finding the average number a lot easier.

greyscale_7_33


Lastest version of the Simulation

November 4, 2009
by Tonje Stolpestad (tstolpes)

greyscale_7_31

I have solved the issue of walking on the road, it is no longer possible. The simulation is still in color (for being pretty and hypnotic, but we only can only mutate and store gene1.


Next Two Weeks

October 28, 2009
by Michael Dale (mrd09)

Two week goals:

— Find exactly what we’re measuring: unless we get a really different, concrete parameter, we’ll probably measuring average number of regions visited vs. bridge width

— Decide on a single base version of our map w/o bridges

— Email the Umass prof that did that paper on corridors. sdestef@forwild.umass.edu

— By the end of two weeks, we should be able to have a guess at weather width and (maybe) number matters. Data analysis will be in progress

I think I already have a base version I like, 7_3. It’s 1000 by 700 pixels, has a collision rate of 40% per step on the road, road/non-conservation area width of 200, max age of 600, and max population of 100.

Base version has no bridges, I have 10 sub-versions with bridges increasing in width by 10 per version. I’ll post 7_3 and spare everyone 7_3_1 through 7_3_10. Soon I’ll have versions with multiple bridges as well.

greyscale_7_31

Also, check out these maps of actual wildlife corridors. The first is for Jaguars, the second is a general corridor in Australia:

http://www.panthera.org/images/JaguarRangeSites_000.jpg

http://newcastleonhunter.com/mediapix/2009/bouddi-kincumber-wildlife-corridor.jpg


Game Plan

October 28, 2009
by Tonje Stolpestad (tstolpes)

There seems to be a discussion going on if the width of corridors matters or not. I found  several papers that mentioned that it didn’t while Charles Ross found papers that said that it did.

What we’ll end up with is either a yes or a no on if our model acts the way nature does (also depends on which idea we are following). If the answer is yes we can make  some predictions of if several smaller corridors will work better  (if width doesn’t matter it should). If the answer is no then we can work on figuring out why it does not act like nature and what we can do to model it better.


Paper worth looking at

October 22, 2009
by Tonje Stolpestad (tstolpes)

http://www.springerlink.com/content/x88792055540187m/

Abstract:

An obvious consequence of exurban land development is fragmentation of natural areas. Fragmentation leaves patches of habitat of various sizes, which can become increasingly isolated as development continues. A compelling approach to mitigation is the creation of corridors. Corridors in their simplest form are strips of habitat that connect patches and allow for wildlife movements. Intuitively, corridors make sense and land planners and managers often find them useful in land conservation. However, do wildlife corridors perform as expected? Do they work for all species? And how should they be configured (e.g., width, length, placement)? This chapter addresses these and other questions related to wildlife corridors and exurban land development.

Written by a prof at Umass


The Simulation, where we are and were to go

October 21, 2009
by Tonje Stolpestad (tstolpes)

Applet (does not feature the data collection)

Where we are:

The simulation is back to greyscale. The current version, greyscale_7, has 3 regions that are all attatched. Each region are attached to both of the others. The regions all have an identifying tag, 1 for the left region, 2 for top right, 3 for bottom right and 0 for the road and bridges.  It starts with 4 circles, all in region 1. Each circle is given a unique id tag. We are recording id, parent, generation (parent’s generation +1), color, birthplace, death place, time of death, and list of regions it has been in.

Download:

greyscale_7

algerian-481

(Algerian needs to be in a folder called data that is in the same folder as greyscale_7)

Where to go from here:

Since we are focusing on the width of the bridge we want to make several simulations with different widths of the bridge (One idea is how does several thinner bridges with a combined width x compare to one big bridge with width x). We can also change the shape of the bridge by making the road wider. A last thing to model is the patch bridge. Instead of a simple bridge like the ones we have in our current model we have several smaller patches that are not quite connected but together form a bridge.